Mining Software Repositories
Mining software repositories is related to both data mining and reverse engineering. Source control repositories, bug repositories, archived communications, deployment logs, and code repositories are examples of software repositories that are commonly available for most software projects. The Mining Software Repositories (MSR) field analyzes and cross-links the rich data available in these repositories to uncover interesting and actionable information about software systems.
Here we apply Learn from the Past (OORP, p.141) — mining repositories allows us to leverage the system’s history to guide current reengineering decisions. By studying past bugs, fixes, and change patterns, we gain evidence for where risks lie and how best to adapt the system.
For example, data in source control repositories, traditionally used to archive code, could be linked with data in bug repositories to help practitioners propagate complex changes and to warn them about risky code based on prior changes and bugs. This follows the principle of Tie Code and Questions (OORP, p.121) — connect what the system does with what stakeholders need to know.
When mining, also use Study the Exceptional Entities (OORP, p.107) — focus on outliers such as files with unusually high bug density or commits with large ripple effects, since these often reveal deeper design or process problems.
In this lab you will mine software repositories, extract and analyze some interesting software artifacts archived in the repositories.
Material and Tools
- Session slides here.
- The following GitHub repos you can use to run the lab experiments
- scottyab/rootbeer
- Skyscanner/backpack (Try it from home since it has very many commits)
- mendhak/gpslogger (Try it from home since it has very many commits)
- thundernest/k-9 (Try it from home since it has very many commits)
- Resources of how to obtain data on GitHub
- GitHub API
- How to create GitHub token or you could use this Generate Token if you do not want to read details.
Steps/Preparations
The following tasks will guide you to carry out the labs of mining software repositories. In the class slides, we have looked at three ways how we can get data from GitHub: cloning the repos using Git, using the GitHub REST API, and using the GitHub GraphQL API.
In this lab we shall go through getting GitHub data using the GitHub REST API.
Task 1
- Create a GitHub token(s) by following the tutorial on the link. Each token corresponds to a GitHub account.
- Fork my repo johnxu21/msrLab. Thereafter, clone the fork onto your laptop to have a local copy of the source code.
- Browse the
srcfolder and rename the fileCollectFiles.pyto<your-names>_CollectFiles.py. - Replace the fake
tokensin the code with your own token. - Thereafter, run the file
<your-names>_CollectFiles.pyand look at the output. The code collects all the files in a repo and also the number of counts the file is touched throughout its lifetime.
Task 2
A repository contains both source files and other files like configuration files. Developers spend most of the time changing source files for many reasons, for example, fixing bugs, extending them with new features, or refactoring. The script CollectFiles.py collects all files in a repository. So your first task is to adapt the script to gather only the source files. You can find a repo’s programming languages on the bottom right of the repo’s page on GitHub (some repos could be written in more than one programming language).
- First, write a script with the name
<'your_firstname'_authorsFileTouches.py>that collects the authors and the dates when they touched for each file in the list of files generated by the adapted file CollectFiles.py (only source files).- This follows Learn from the Past (OORP, p.141) — mining commit histories and author activity helps us base reengineering on evidence rather than speculation.
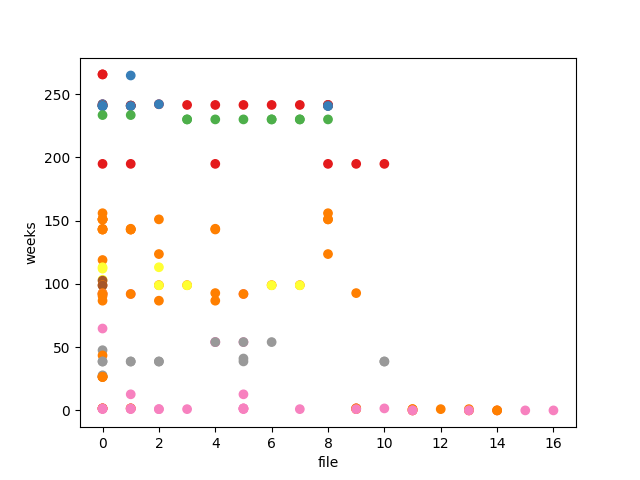
- Second, write a script that generates a scatter plot (using matplotlib) of weeks vs file
variables where the points are shaded according to author variable. Each author should have
a distinct color. Looking at the scatter plot one should be able to tell a file that is
touched many times and by whom.
- This supports Study the Exceptional Entities (OORP, p.107) — heavily modified or unusually shared files stand out as potential hotspots for refactoring.
- It also reflects Tie Code and Questions (OORP, p.121) — the visualization answers concrete questions about developer activity and file volatility that matter during reengineering.
This can help, for example, when identifying refactoring
opportunities, which developer should be allocated the task since they have touched a file
many times or have recently worked on the file. You can name the script for drawing the
histogram <'your_firstname'_scatterplot.py>.
You get a hint on how draw the scatter plot on this link on Stackoverflow.
Example (scottyab/rootbeer)
The repository scottyab/rootbeer has a total of 17 unique source files (‘.java’). It has a total
of 33 authors who have touched the 17 unique files (the data points in the graph) who have been
updating the files and committing their changes. The scatter plot below shows the authors
activities over time for the repository scottyab/rootbeer.
Task 3
Write a script to extract data from the following merged pull requests [11791, 11686, 11591, 12159, 12073, 11981, 11867, 11991, 12207, 11926, 11847]
in the repository apache/kafka.
Read about how to extract pull request from the following site GitHub Pull Request API
For example, given a pull request number = 1347 for the repo octocat/Hello-World, the follwoing API would return a json file the pull request details:
https://api.github.com/repos/octocat/Hello-World/pulls/1347
The file Pull request details
is an example output for the pull request number 11577 and 11686 for the repo apache/kafka.
Store the output in .csv file.
Note on the Upcoming Quiz
- For this lab, the quiz will include a mix of MCQs and Short Answer Questions (SAQs).
- At least 4 of the 10 questions will be SAQs. These will require you to:
- Run or adapt the scripts you developed in the lab.
- Copy and paste small outputs (e.g., top files, author activity, PR data).
- Write short explanations using your results, sometimes connecting them to reengineering patterns.
How to prepare:
- Make sure your lab scripts run correctly and produce the expected outputs.
- Save or bookmark key results (CSV, scatter plot, API responses) so you can access them quickly during the quiz.
- Review the patterns used in the lab (Learn from the Past, Tie Code and Questions, Study the Exceptional Entities) since you may need to apply them.